Advanced Network Protocol Analyzer Review: Colasoft Capsa Enterprise 11
Firewall.cx has covered Colasoft Capsa several times in the past, but its constant improvements make it well worth revisiting. Since the last review, the version has bumped from 7.6.1 to 11.1.2+, keeping a similar interface but scoring plenty of new features. In fact, its change is significant enough to warrant a full re-evaluation rather than a simple comparison.
For the unfamiliar, Colasoft Capsa Enterprise is a widely respected network protocol analyzer that goes far beyond free packet sniffers like Wireshark. It gives users detailed information about packets, conversations, protocols, and more, while also tying in diagnosis and security tools to assess network health. It was named as a visionary in Gartner’s Magic Quadrant for Network Performance Monitoring and Diagnostics in 2018, which gives an idea of its power. Essentially, it’s a catch-all for professionals who want a deeper understanding of their network.
Installing Capsa Enterprise 11
The installation of Capsa Enterprise is a clear merit, requiring little to no additional configuration. The installer comes in at 84 MB, a very reasonable size that will be quick to download on most connections. From there, it’s a simple case of pressing Next a few times.
However, Colasoft does give additional options during the process. There’s the standard ability to choose the location of the install, but also choices of a Full, Compact, or Custom install. It lets users remove parts of the network toolset as required to reduce clutter or any other issues. Naturally, Firewall.cx is looking at the full capabilities for the purpose of this review.
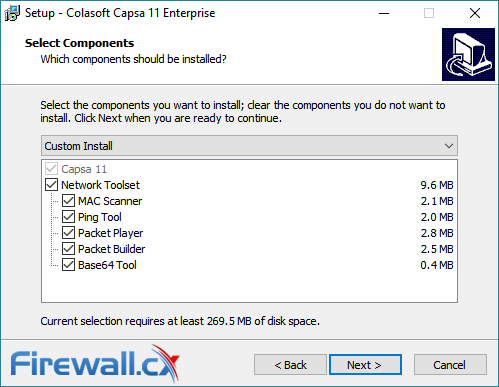
The entire process takes only a few minutes, with Capsa automatically installing the necessary drivers. Capsa does prompt a restart after completion, though it can be accessed before then to register a serial number. The software offers both an online option for product registration and an offline process that makes use of a license file. It’s a nice touch that should appease the small percentage of users without a connection.
Using Capsa Enterprise 11
After starting Capsa Enterprise for the first time, users are presented with a dashboard that lets them choose a network adapter, select an analysis profile, or load packet files for replay. Selecting an adapter reveals a graph of network usage over time to make it easier to discern the right one. A table above reveals the speed, number of packets sent, utilization, and IP address to make that process even easier.
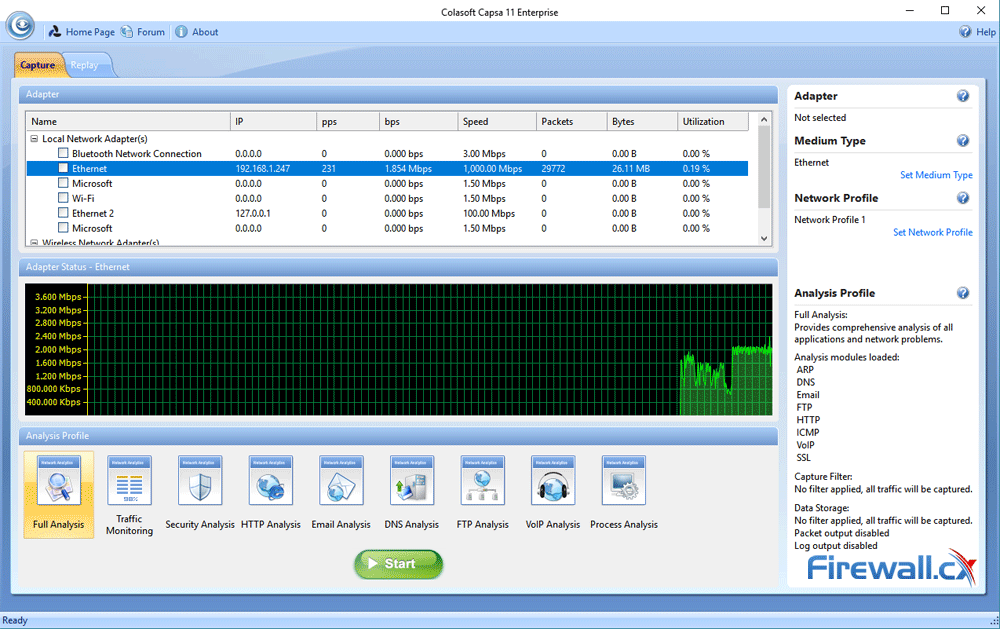
However, it’s after pressing the Start button that things get interesting. As data collection begins, Capsa starts to display it in a digestible way, revealing live graphs with global utilization, total traffic, top IP addresses, and top application protocols.
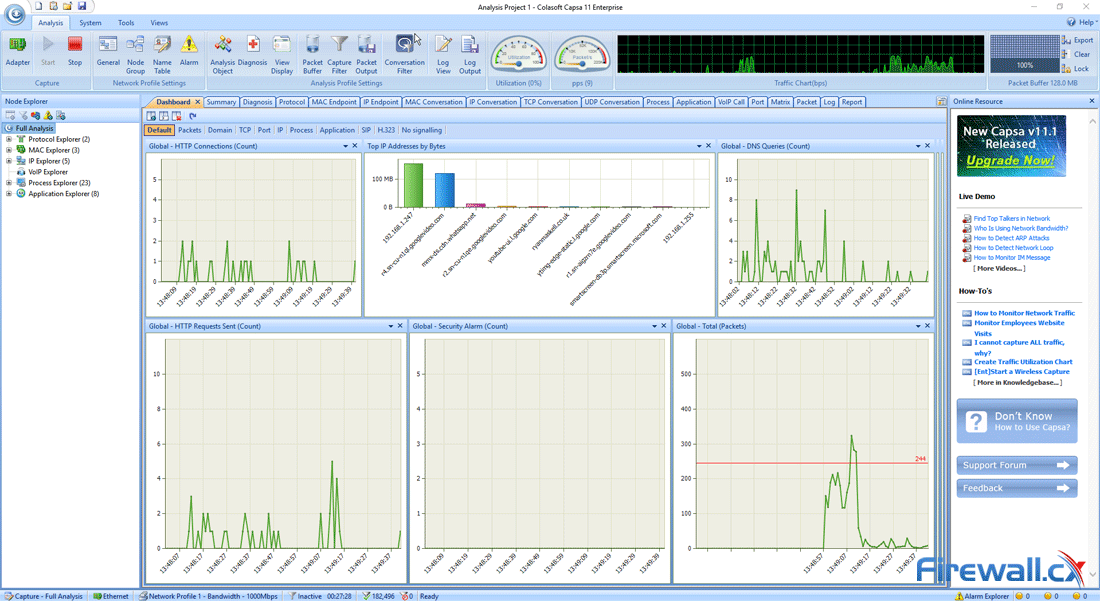
Users can customize this default screen to display most of the information Capsa collects, from diagnoses to HTTP requests, security alarms, DNS queries, and more. Each can be adjusted to update at an interval from 1 second to 1 hour, with a choice between area, line, pie, and bar charts. The interface isn’t the most modern we’ve seen, but it’s hard to ask for more in terms of functionality.
Like previous versions, Capsa Enterprise 11 also presents several tabs and sub-tabs that provide deeper insights. A summary tab gives a full statistical analysis of network traffic with detailed metadata. A diagnosis tab highlights issues your network is having on various layers, with logs for each fault or performance issue.
In fact, the diagnosis tab deserves extra attention as it can also detect security issues. It’s a particular help with ARP poisoning attacks due to counts of invalid ARP formats, ARP request storms, and ARP scans. After clicking on the alert, admins can see the originating IP and MAC address and investigate.
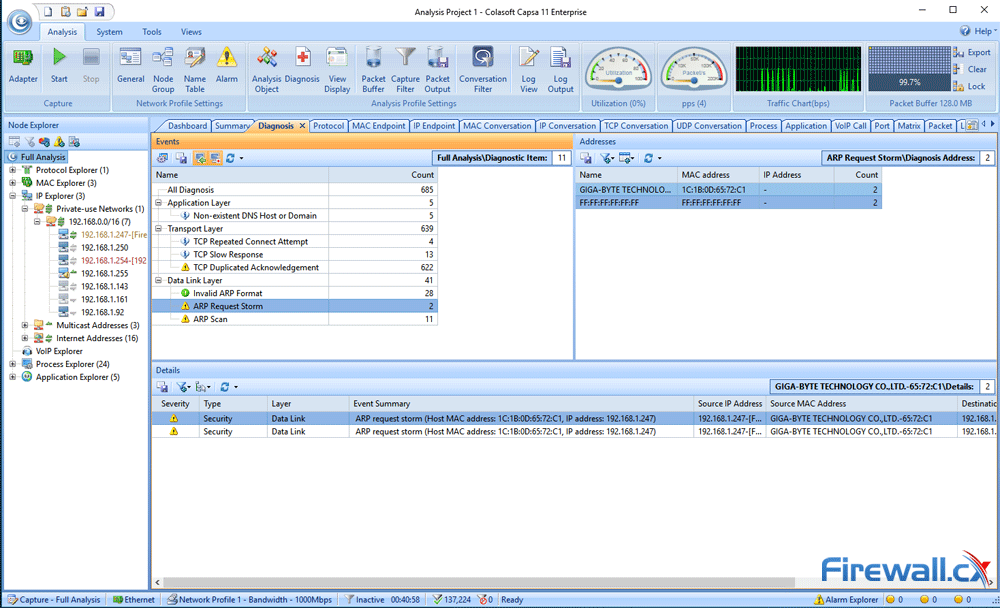
When clicking on the alert, Capsa also gives possible causes and resolutions, with the ability to set up an alarm in the future via sound or email. An alarm explorer sub-menu also gives an overview of historic triggers for later review. To reduce spam, you can adjust your alarms or filter specific errors out of the diagnosis system.
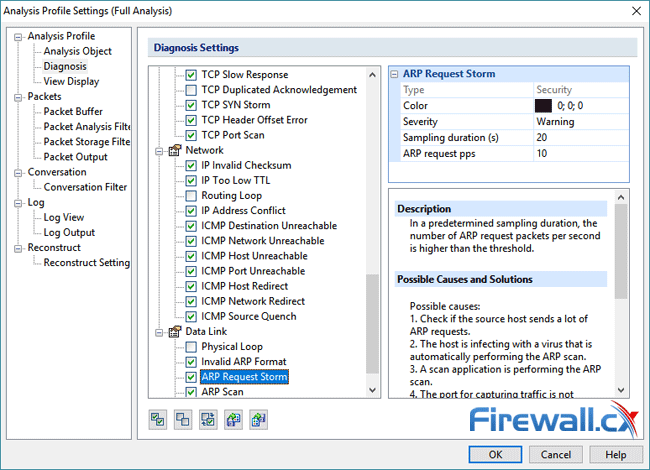
Naturally, this is a great help, and the ability to define such filters is present in every aspect of the software. You can filter by IP, MAC address, and issue type, as well as more complex filters. Admins can remove specific traffic either at capture or afterward. Under Packet Analysis, for example, you can reject specific protocols like HTTP, Broadcast, ARP, and Multicast.
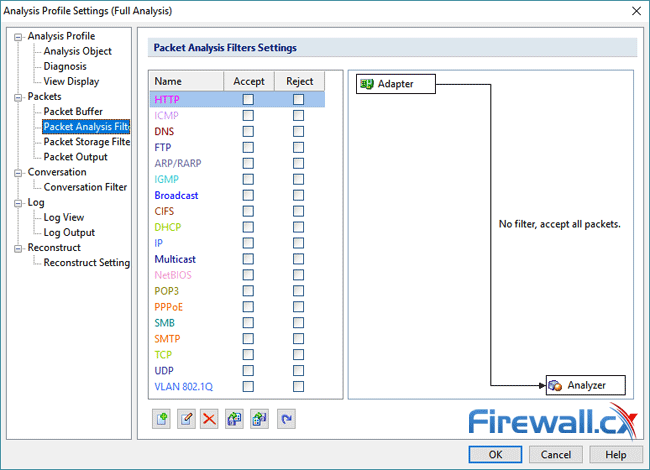
If you filter data you’ve already captured, it gets even more powerful, letting you craft filters for MAC addresses in specific protocols, or use an advanced flowchart system to include certain time frames. The massive level of control makes it far easier to find what you’re looking for.
After capture is complete, you can also hit the Conversation Filter button, a powerful tool that lets you accept/reject data in the IP, TCP, and UDP Conversations tabs. Again, it takes advantage of a node-based editor plus AND/OR/NOT operators for easy creation. You can even export the filters for use on a different PC.
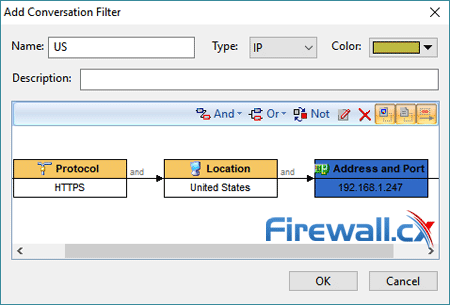
When you begin a capture with conversation filters active, Capsa will deliver a pop-up notification. This is a small but very nice touch that should prevent users wondering why only certain protocols or locations are showing.
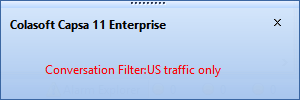
Once enabled, the filter will begin adjusting the data in the tab of the selected conversation type. Admins can then analyze at will, with the ability to filter by specific websites and look at detailed packet information.

The packet analysis window gives access to further filters, including address, port, protocol, size, pattern, time, and value. You can also hit Ctrl+F to search for specific strings in ASCII, HEX, and UTF, with the ability to choose between three layout options.
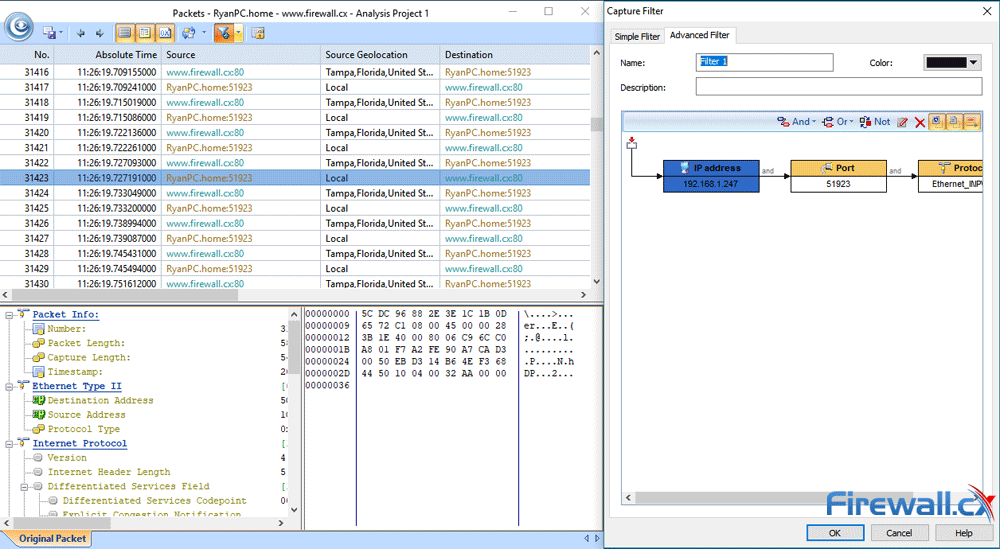
However, though most of your time will be spent in Capsa’s various details, its toolbar is worth a mention. Again, there’s a tabbed interface, the default being Analysis. Here you’ll see buttons to stop and start capture, view node groups, set alarms for certain diagnoses, set filters, and customize the UI.

However, most admins will find themselves glancing at it for its pps, bps, and utilisation statistics. These update every second and mean you can get a quick overview no matter what screen you’re on. It combines with a clever grid-based display for packet buffer, which can be quickly exported for use in other software’s or replays.
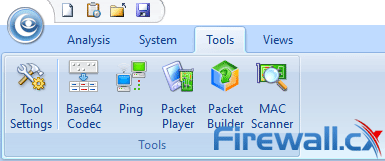
Another important section is the Tools tab, which gives access to Capsa’s Base64 Codec, Ping, Packet Player, Packet Builder, and MAC Scanner applications. These can also be accessed via the file menu in the top left but having them for quick access is a nice touch.
Finally, a Views tab gives very useful and quick access to a number of display modes. These enable panels like the alarm view and let you switch between important options like IP/MAC address only or name only modes.

In general, Colosoft has done a great job of packing a lot of information into one application while keeping it customizable. However, there are some areas where it really shines, and its Matrix tab is one of those. With a single click, you can get a visual overview of much of the conversations on a network, with Top 100 MAC, MAC Node, IP Conversation, and IP Node views:
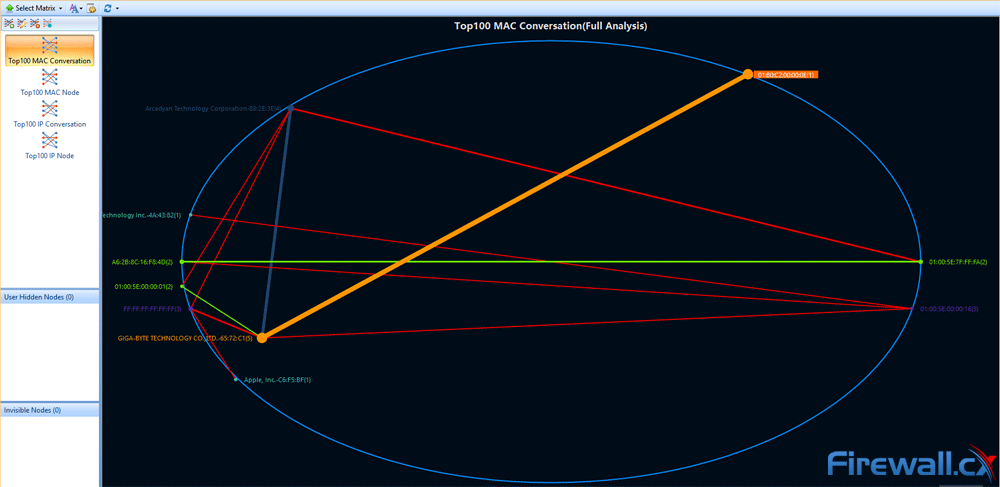
Firewall.cx has praised this feature before and it remains a strong highlight of the software. Admins are able to move the lines of the diagrams around at will for clarity, click on each address to view the related packets, and quickly make filters via a right click interface.
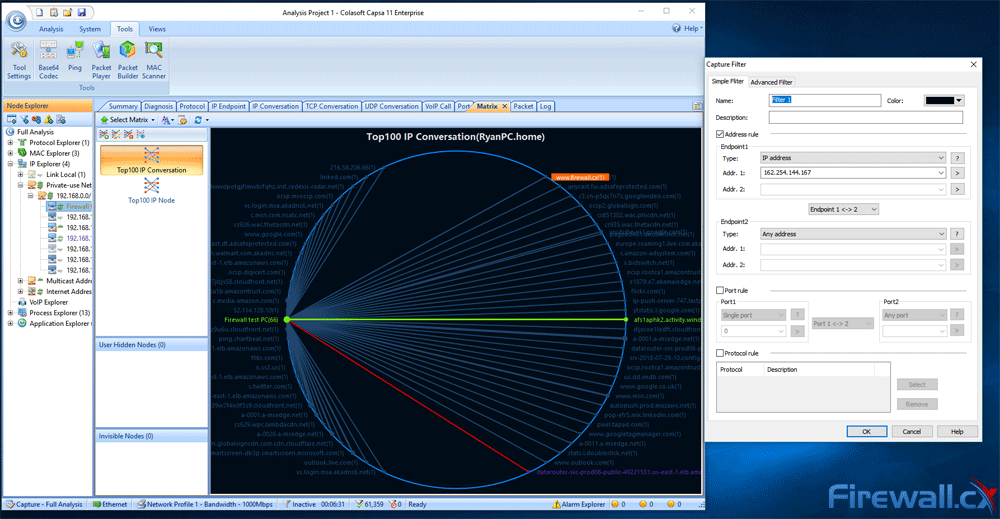
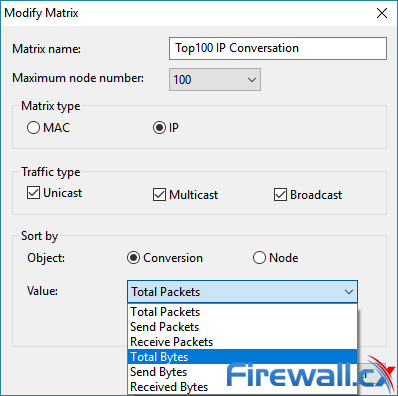
The information above is from a single PC, so you can imagine how useful it gets once more devices are introduced. You can select individual IP addresses in the node explorer on the left-hand side to get a quick overview of their IP and MAC conversations, with the ability to customize the Matrix for a higher maximum node number, traffic types, and value.
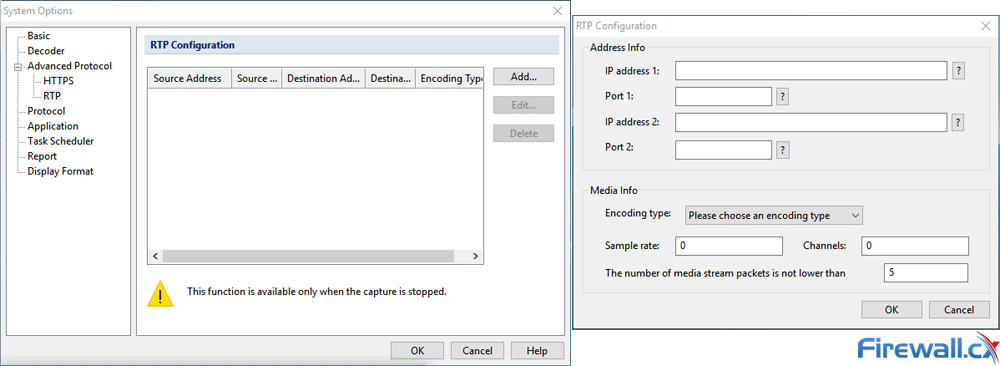
Thanks to its v7.8 update, Capsa also has support for detailed VoIP Analysis. Users can configure RTP via the System>Decoder menu, with support for multiple sources and destination addresses, encoding types, and ports.
Once everything is configured correctly, admins will begin to see the VoIP Call tab populate useful information. A summary tab shows MOS_A/V distribution with ratings between Good (4.24-5.00) and Bad (0.00-3.59). A status column shows success, failure, and rejection, and a diagnosis tab keeps count of setup times, bandwidth rejects, and more. While our test environment didn't contain VoIP traffic we still included the screesnhot below to help give readers the full picture.
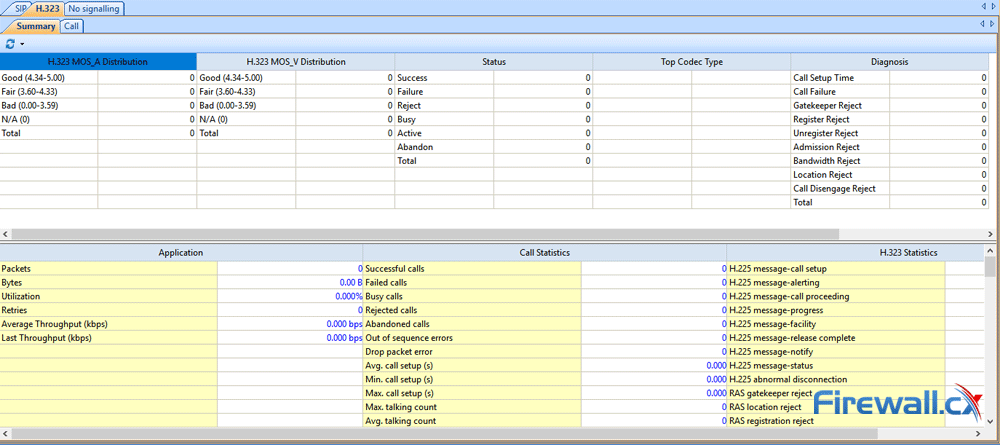
In addition, a window below keeps track of packets, bytes, utilization, and average throughput, as well as various statistics. Finally, the Call tab lists numbers and endpoints, alongside their jitter, packet loss, codec, and more. Like most aspects of Capsa, this data can be exported or turned into a custom report from within the software.
Capsa Enterprise 11 creates a number of these reports by default. A global report gives an overview of total traffic with MAC address counts, protocol counts, top MAC/IP addresses, and more. There are also separate auto-generated reports for VoIP, Conversation, Top Traffic, Port, and Packet.
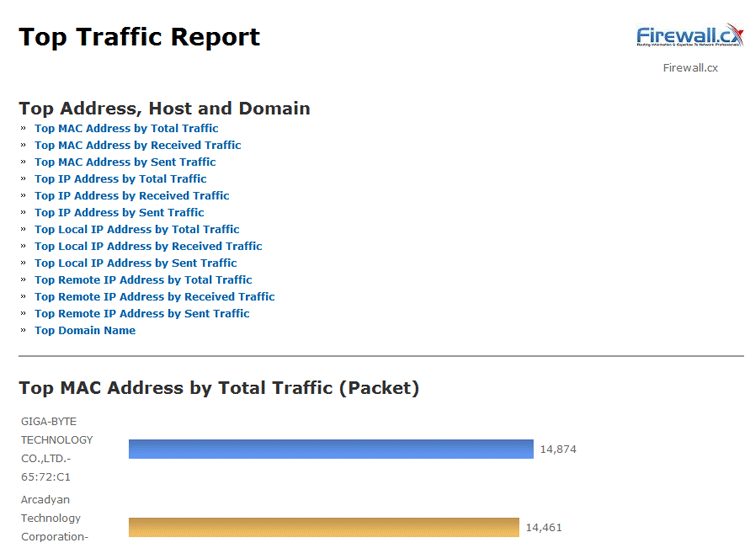
You can customize these with logo and author name, but they’re missing many of the features you’d see in advanced reporting software. There’s no option for a pie chart, for example, though they can be created via the node explorer and saved as an image.
Conclusion
Capsa Enterprise 11 is a testament to Colasoft’s consistent improvements over the years. It has very few compromises, refusing to skimp on features while still maintaining ease of use. Capsa comes in two different flavors – Enterprise version or the Standard version, making it an extremely affordable & robust toolset with the ability to reduce the downtime and make troubleshooting an enjoyable process.
Though its visual design and report features look somewhat dated, the layout is incredibly effective. Admins will spend much of their time in the matrix view but can also make use of very specific filters to deliver only the data they want. It got the Firewall.cx seal of approval last time it was reviewed, and we feel comfortable giving it again.
Your IP address:
3.149.241.32
Wi-Fi Key Generator
Follow Firewall.cx
Cisco Password Crack
Decrypt Cisco Type-7 Passwords on the fly!


