Software Review: Colasoft Capsa 7 Enterprise Network Analyzer
Reviewer: Arani Mukherjee
 Colasoft Capsa 7.2.1 Network Analyser was reviewed by Firewall.cx a bit more than a year ago. In a year Colasoft has managed to bring in the latest version of the Analyser software i.e. Version 7.6.1.
As a packet analyser, Colasoft Capsa Enterprise has already collected many accolades from many users and businesses, so I would refrain from turning this latest review into a comparison between the two versions. Since Colasoft has made the effort to give us a new version of a well established software, it’s only fair that I perform the review in light of the latest software. This only goes to prove that the new software is not just an upgraded version of the old one, but a heavy weight analyser in its own right.
As an effective packet analyser, the various functions performed are: detecting network issues; intrusion and misuse; isolating network problems; monitoring bandwidth; usage; data in motion; end point security and server as a day to day primary data source for network monitoring and management. Capsa is one of the most well known packet analysers available for use today and the reasons it occupies such an enviable position in the networking world are its simplicity in deployment, usage, and data representation. Let’s now put Capsa under the magnifying glass to have a better understanding of why it’s one of the best you can get.
Installing Colasoft Capsa Enterprise
I have mentioned before that I will not use this as an opportunity for comparison between the two versions. However, I must admit, Capsa has retained all the merits displayed in the older version. This is a welcome change as often I have witnessed newer versions of software suddenly abandoning certain features just after all the users have got used to it. So in light of that, the first thing notable is the ease of installation of the software. It was painless from the time you download the full version or the demo copy til you put in the license key information and activate it online. There are other ways of activating it but as a network manager why would someone install a packet analyser on a machine which does not have any network connection.
It takes 5-7 minutes to get the software up and running to a point where you can start collecting data about your network. It carries all the hallmarks of a seamless easy installation and deployment and for all of us, one less thing to worry about. Bearing in mind some of you might find an adhoc review of this software already done while Colasoft’s nChronos Server was being reviewed, I will try not to repeat myself.
Using Capsa Enterprise
You will be greeted with a non cluttered well designed front screen as displayed below.
The default view is the first tab called Dashboard. One you have selected which adapter you want to monitor, and you can have several sessions based on what you do, you hit the ‘Start’ button to start collecting data. The Dashboard then starts coming up with data as it is being gathered. The next screenshot shows what your dashboard will end up looking like:
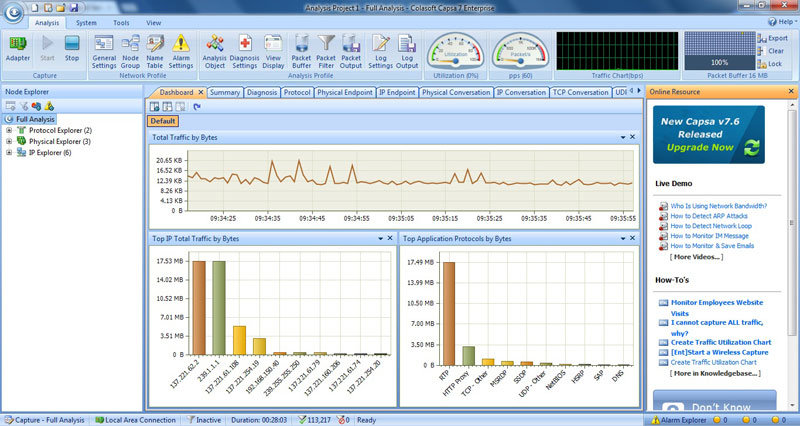
Every tab on this software will display data based on what you want to see. In the Node Explorer on the left you can select either a full analysis or particular analysis based on either protocol, the physical nodes or IP nodes.
The Total Traffic Graph is a live progressing chart which can update its display as fast as 1 second, or as slow as up to 1 hour. If you don’t fancy the progressing line graph, you can ponder the bar chart at the bottom. For your benefit you can pause the live flow of the graph by right clicking and selecting ‘Pause Refresh’, as show below:
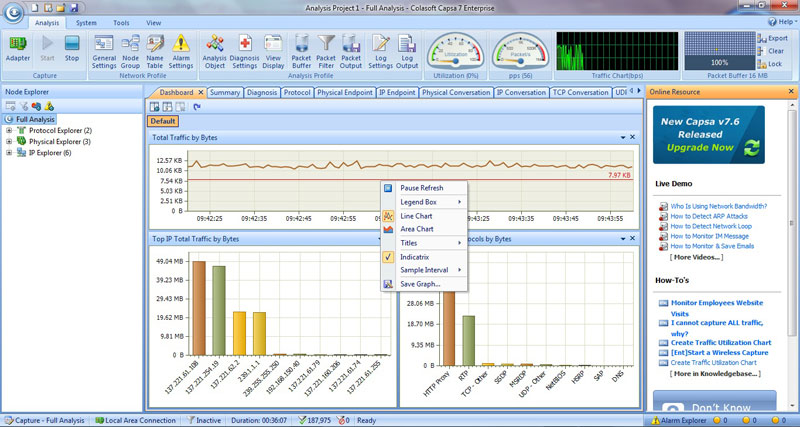
The toolbar at the top needs particular mention because of the features it provides. My favourite was obviously the Utilisation and PPS meters. I forced a download from an FTP site and captured how the needles reacted. Also note the traffic chart which captured bytes per second. The needle position updated every 1 second:

The Summary tab is there to provide the user with a full statistical analysis of the network traffic. The separated sections are self explanatory and do provide in-depth meta data.
The Diagnosis tab is of particular interest. It gives a full range view of what’s happening to the data in the network in terms of issues encountered:
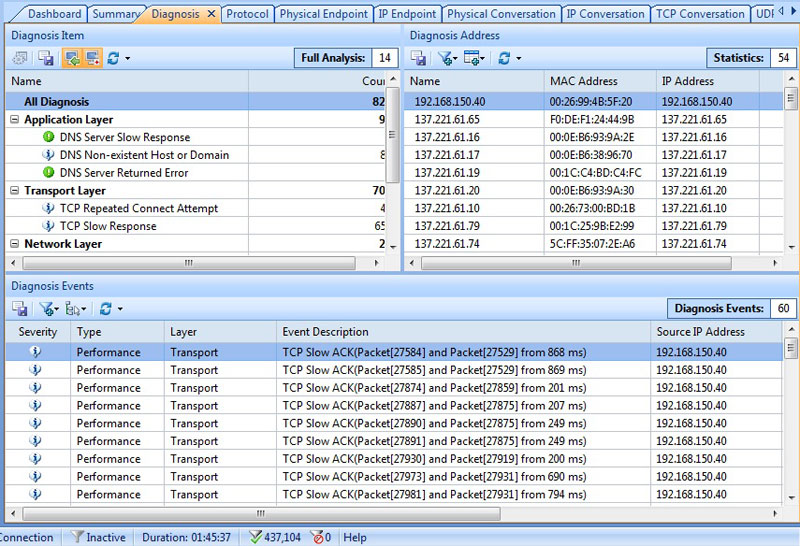
The diagnosis is separated in terms of the actual layers, severity and event description. This I found to be very useful when defining the health of my network.
The Protocol tab gave me a ringside view of the protocols that were topping the list and what was responsible for what chunk of data flowing through the network. I deemed it useful when I wanted to find out who’s been downloading too much using FTP, or who has set up a simultaneous ping test of a node.
Physical and IP Endpoints tabs showed data conversations happening between the various nodes in my network. I actually used this feature to isolate two nodes which were responsible for a sizeable chunk of the network traffic within a LAN. A feature I’m sure network managers will find useful.
Physical, IP, TCP, and UDP Conversations is purely an expanded form of the info provided at the bottom of the previous two tabs.
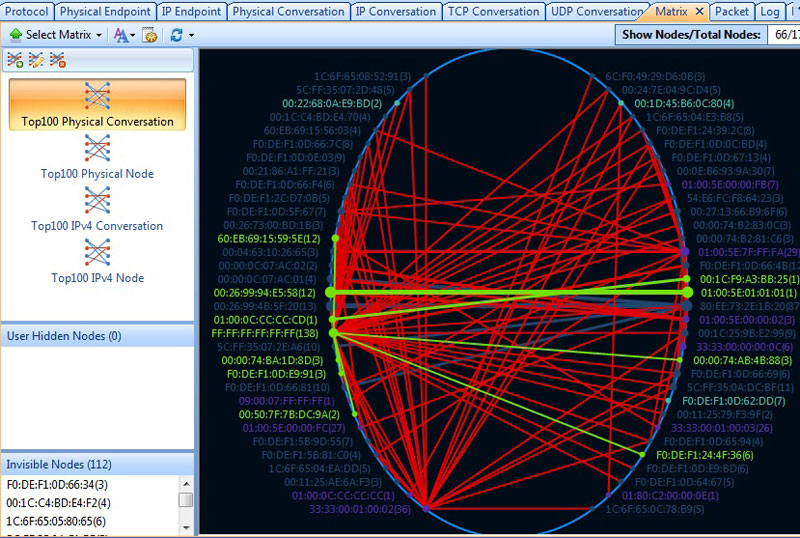
My favourite tab was the Matrix. Not because of just the name but because of what it displayed. Every data transfer and its corresponding links were mapped based on IP nodes, Physical nodes. You also have the luxury of only seeing the top 100 in the above categories. Here’s a screenshot of my network in full bloom, the top 100 physical conversations:
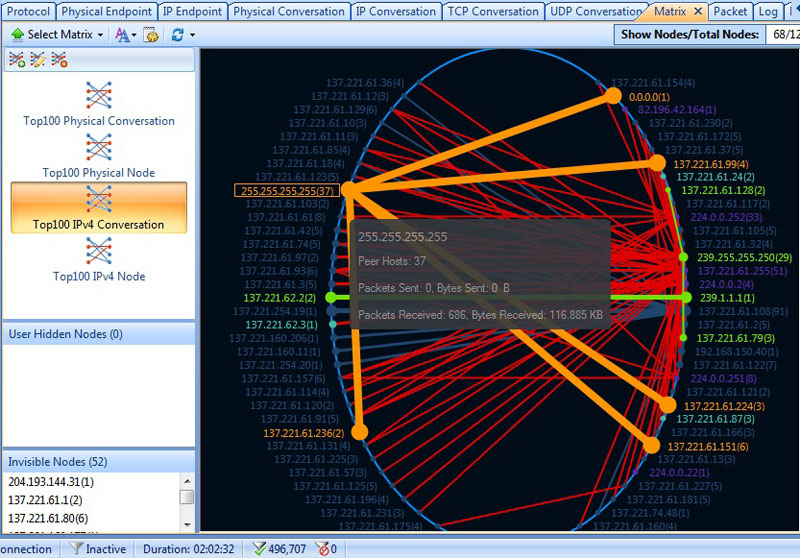
The best display for me was when I selected Top 100 IPv4 Conversations and hovered the mouse over one particular conversation. Not only did Capsa tell me how many peers it was conversing with, it also showed me how many packets were received and sent:
Further on the Packet tab is quite self explanatory. It shows every packet spliced up into its various protocol and encapsulation based components. This is one bit that definitely makes me feel like a Crime Scene Investigator, a feeling I also had while reviewing nChronos. I also sensed that this also helps in terms of understanding how a packet is built, and transferred across a network. Here’s a screenshot of one such packet:
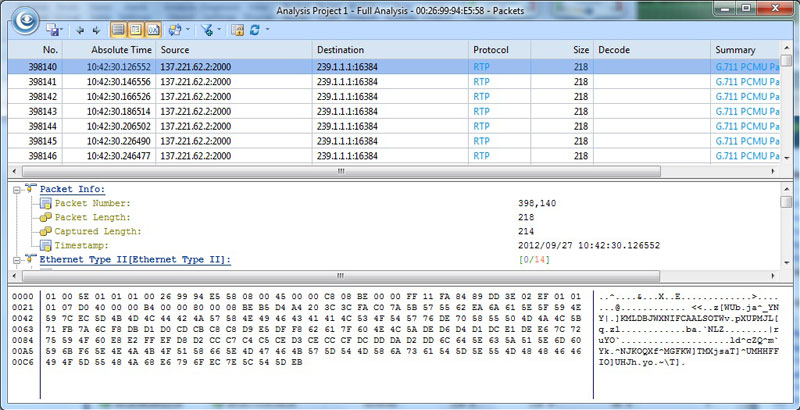
As shown above, the level of detail is exhaustive. I wish I’d had this tool when I was learning about packets and their structure. This would have made my learning experience a bit more pleasurable.
All of this is just under the Analysis section. Under the Tools section, you will find very useful applications like the Ping and the MAC Scanner. For me, the MAC Scanner was very useful as I could take a snapshot of all MAC addresses and then be able to compare any changes at a later date. This is useful if there is a change in any address and you are not aware of it. It could be anything from a network card change to a new node being added without you knowing.
I was pleasantly surprised about the level of flexibility of this software when it came to how you wish to see the data. There is the option to have your own charts, add filters against protocols to ignore data that is not important, create alarm conditions which will notify if a threshold is broken or met. A key feature for me was to be able to store packet data and then play it later on using the Packet Player, another nice tool in the Tools section. This historical lookup facility is essential for any comparison that needs be performed after a network issue has been dealt with.
Summary
I have worked with several packet or network analysers and I have to admit Capsa Enterprise captures data and displays it in the best way I have seen. My previous experiences were marred by features that were absent and features that didn’t work or deliver the expected outcome. Colasoft has done a brilliant job of delivering Capsa which meets all my expectations. This software is not only helpful for the network managers but also for students of computer networking. I definitely would have benefitted from Capsa had I known about it back then, but I have now. This tool puts network managers more in control of their networks and gives them that much needed edge for data interpretation. I would tag it with a ‘Highly Recommended’ logo.
Wi-Fi Key Generator
Follow Firewall.cx
Cisco Password Crack
Decrypt Cisco Type-7 Passwords on the fly!


