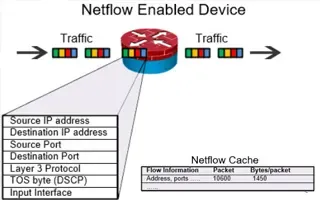
Netflow vs SNMP. Two Different Approaches to Network Monitoring
 SNMP (Simple Network Management Protocol) and Netflow are both popular protocols with admins, prized for their ability to give visibility over the network and in some cases discern the cause of network performance issues, network bottlenecks, system resource allocation issues and more. On the Netflow side of things, third-party software vendors like ManageEngine can greatly enhance the usability and capability of the protocol, while SNMP network monitoring applications like PRTG, Solarwinds or alternatively open-source Observium, Nagios and LibreNMS take the lead in delivering a comprehensive in-depth network and system monitoring solution.
Unfortunately, however, the close relationship between the two protocols, especially when it comes to software offerings, has birthed some misconceptions. While it’s common to see SNMP and Netflow as more or less interchangeable, there are some significant and key differences between the two that make them suited for very different use cases.
Key Topics:
- Understanding SNMP and how it works
- Understanding Netflow and how it works
- Netflow vs SNMP: Similarities and differences, using real examples
- Netflow vs SNMP: Advantages and disadvantages, using real examples
- Netflow vs SNMP - Conclusion
Related Articles:
- Complete Guide to Netflow: How Netflow & its Components Work. Netflow Monitoring Tools
- Netflow: Monitor Bandwidth & Network Utilization. Detect LAN, WAN, Wi-Fi Bottlenecks, Unusual Traffic Patterns, Problems and more
- NetFlow Analyzer: Free Download, Step-by-Step Installation, Configuration & Optimization Windows - Linux
Understanding SNMP and How it Works
The Simple Network Management Protocol (SNMP) surfaced as early as 1988, with its roots in its predecessor, the Simple Gateway Monitoring Protocol, which was defined in 1987. SNMP was born out of pure necessity – before its existence, network admins didn’t have much visibility over their infrastructure at all. After the crash of the ARPAnet, on the 27th of October 1980, and as the number of complex components in networks began to snowball, it was clear a solution was needed.
However, though SNMP was initially built by a group on university researchers as a temporary solution, it quickly evolved, has remained very relevant even today. It’s not considered part of the application layer of the Internet Protocol Suite and OSI model and exists across three major versions (through SNMPv1 still tends to be the most commonly used).
Though SNMP’s name suggests management, it’s more commonly used for the monitoring of different types of network equipment, both on a network and hardware level. Typically, a monitoring server (e.g Nagios, Observium) known as a SNMP Manager monitors devices on the network, with each system holding a software snmp agent that reports information back to the manager:

Illustrating how SNMP works
The SNMP protocol’s job is to send Protocol Data Units (PDUs) messages to other devices in the network, requesting information via an SNMP Get-Request. The sum of the Get-Responses it receives lets network admins track network events via the data it receives. The speed of this process lets admins keep an eye on a network in almost real-time, which is in many cases invaluable. While the SNMP query interval is customizable in every SNMP monitoring application, it is typically configured to poll the monitored device every 5 minutes.
SNMP operates on port 161 and uses UDP as its transport protocol.
Understanding Netflow and How It Works
Though we have covered Netflow extensively in our Complete Guide to Netflow, it’s worth quickly brushing over it. The Cisco Netflow protocol is newer than SMNP, beginning its evolution in 1996 with Cisco’s IOS v11.x. Though it was initially designed a software technique, the company soon implemented hardware-based Cisco Netflow solutions in its switches and expanded it to other hardware.
Netflow consists of three components:
- Netflow Exporter: Typically, a router or firewall that gathers packets into flows and exports flow records to collectors when it decides the flow of information has exported.
- Netflow Collector: A server that receives the aggregated flows and stores and pre-processes them for use by the Netflow Analyzer.
- Netflow Analyzer: A software-based solution that provides necessary insights into the data collected, such as ManageEngine.

Netflow's components: Flow Exporter, Flow Collector and Flow Analyzer
As you can see, the two protocols (Netflow – SNMP) differ significantly in their technique and makeup, there are some areas they cross over and others where they’re significantly different.
Netflow records are exported by the Flow Exporter using the UDP transport protocol. Common ports used are 2055, 9555, 9995, 9025, 9026 and are usually configurable.
Netflow vs SNMP: Similarities and Differences, using Real Examples
As both Netflow and SNMP provide network monitoring, there’s some crossover with the information they provide. Both can give a quick overview of the bandwidth usage and utilization to the end-user, and these days both protocols are supported by all major vendors, though SNMPs age still means it has an advantage in that regard.
However, it’s past that the SNMP protocol and Netflow begin to diverge. As mentioned earlier, SNMP provides a real-time overview of the network, but Netflow is a little more limited. Though it tends to provide more verbose information, it isn’t live, instead returning data in predetermined intervals that tend to cap out at a couple of minutes at the shorter end. Additionally, SNMP operates in both push and pull modes, while Netflow is primarily a push technology.
Netflow, however, is more compact and delivers more information in many areas when compared to the SNMP protocol, which is in many ways quite crude. Unlike SNMP, Netflow can filter traffic and differentiate bandwidth usage by protocol or IP. The enablement of filtering and differentiation by protocol and application gives a complete overview of link to application utilization, while SNMP is limited to the interface level.
The example below shows how SNMP (top graph) and Netflow (bottom graph) report traffic passing through a monitored interface on a network device (firewall). While both protocols are capable of showing the overall traffic passing through the interface, Netflow provides a per-application break-down of traffic:

Comparing SNMP and Netflow network traffic reports from the same source
When monitoring WAN links within an organisation, it is critical to have the ability to properly analyze traffic. SNMP graphs are simply not enough. In the above example, ManageEngine’s Netflow shows the bittorrent application responsible for a large portion of the bandwidth used.
An unexpected spike in traffic can signal problems, a security issue or even a breach in the company’s IT policies. This example highlights an important difference between SNMP and Netflow when used to monitor traffic.
The knock-on effect of this is that Netflow tends to be more difficult to setup. Most of the time, getting netflow configured can be somewhat tricky depending on the device and netflow version supported. Its verbosity also means it can be more intensive and require more bandwidth than SNMP depending on the amount of traffic passing through the monitored links, however with today’s high-bandwidth links this shouldn’t be of any real concern.
Despite this, there is an area where SNMP provides information where Netflow doesn’t – hardware. SNMP is capable of monitoring CPU, memory, disk space, temperature for devices, and more, something Netflow has only been able to do so far in proof of concepts.
The below screenshot is an example of an SNMP-monitored Palo Alto Next-Gen Firewall:

Monitoring a Palo Alto Next-Gen Firewall via SNMP
Our SNMP monitoring server is configured to poll the firewall every 5 minutes and pull a significant amount of information that includes internal bandwidth usage, CPU, memory and storage usage, temperature, event logs and more.
Netflow vs SNMP: Advantages and Disadvantages, using Real Examples
It should be evident that each protocol has different use cases but they also complement each other. When it comes to analyzing traffic information, Netflow is clearly the winner, and it also scales better on the high-traffic networks that professionals are more likely to see.
Netflow’s ability to differentiate and filter by protocol or application means network security professionals can determine which end system is using excessive bandwidth but also assist identifying possible security threats.
The below screenshot, taken from ManageEngine’s Netflow Analyzer, is a great example on how Netflow can assist in identifying abnormal traffic patterns, including malformed packets, excessive flows and more:

ManageEngine's Netflow security threats interface
In practice, this means you can utilize Netflow to monitor specific aspects like voice and video quality across a network, something just not possible with SNMP. This includes link latency, jitter, call path availability and other important metrics.
The verbose data also better lends its hand to reporting, which can then be used for network planning or other considerations. For example, you can quickly produce capacity planning reports, get an accurate overview of trends over a long period, and measure bandwidth growth over time. It can also recognise even non-standard applications or those who use dynamic port numbers.
 Capacity planning with ManageEngine
The SNMP protocol’s main advantage is that it is supported widely by almost every type of device that connects to the network and is capable of delivering strong, basic traffic visibility with very low overhead. It can provide efficient quantitative information, including bandwidth, but also detailed system resource usage:
 SNMP monitoring of an ESXi host (click to enlarge)
In the above example, our SNMP monitored host is a lab ESXi server with its SNMP service enabled. The amount of information obtained by SNMP is impressive and detailed: Server information, model number, operating system, port utilization, memory and storage usage, CPU usage and more, are tracked and updated every 5 minutes.
Drilling into further detail, e.g CPU usage, is simple as hovering on-top of the CPU, allowing a pop-up embedded window appear, revealing each core usage over time:
 SNMP monitoring of an ESXi's host CPU (click to enlarge)
Combining this information with automated alerts, makes SNMP monitoring a powerful tool that cannot however be replaced by Netflow.
Conclusion
The SNMP and Netflow protocol are both standards for a reason. They both have their advantages and disadvantages, and generally both can be used simultaneously to monitor different aspects of a network and its critical devices. Netflow’s aid in network planning and traffic analysis makes it, in many cases, the more helpful tool to network administrators. On the other hand, SNMP’s capabilities to provide overall traffic graphs and detailed resource usage, make it a favourite for system administrators.
Third-party advanced tools like ManageEngine combine the best of both SNMP and Netflow by monitoring every aspect of the network in a simple yet information packed-UI and enabling monitoring of traffic shaping technologies, security alerts, SLAs and more.
Though those interested in networking and system administration should naturally try both SNMP and Netflow tools for themselves, no regrets will be found after taking the time to utilize Netflow and its more diverse functionality.
Your IP address:
3.16.10.2
Wi-Fi Key Generator
Follow Firewall.cx
Cisco Password Crack
Decrypt Cisco Type-7 Passwords on the fly!


