The Importance of a Network Analyzer – Packet Sniffer. Must-Have Features for Demanding Engineers & Administrators
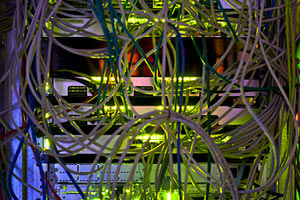 Network Analyzers, also known as Packet Sniffers, are amongst the most popular network tools found inside any Network Engineer’s toolkit. A Network Analyzer allows users to capture network packets as they flow within the enterprise network or Internet.
Engineers usually make use of Network Analyzers to help uncover, diagnose and fix network problems, but they are also used by hackers to obtain access to sensitive information and user data.
Features Offered In High-Quality Network Analyzers
When dealing with network problems, engineers usually follow standard tests to try to identify the source of the problem and make any necessary corrections. These tests usually involve checking the source (Client or Network device) IP address, Gateway, DNS server, Nslookup and performing a few ICMP Echo Requests (aka Ping) to verify connectivity with the local network and destination IP.
These methods are usually enough to diagnose simple problems, but are clearly inadequate when dealing with complex network problems. This is where a high-quality network analyzer comes into play.
Any typical network analyzer will capture and display packets, providing basic packet information such as time of capture, source & destination MAC address, source & destination IP address, Layer 4 protocol information (TCP/UDP flags, ports, sequence/acknowledgement numbers) and the data payload. While this information is extremely useful information, it often means that additional time is required by the engineer to locate the data stream/conversation of interest and track down all associated packets.
Further analysis of the captured data usually increases the difficulty and expertise level required to make sense of the information captured.
Let’s take a look at the most important features high-end network analyzers have, that helps simplify complex troubleshooting in our everyday routine.
Extensive How-To articles can be found in our Network Protocol Analyzers section.
Real-Time Network Card Utilization
Real-time network card utilization is a very handy ‘visual tool’ as it shows the bandwidth utilization of the network card used to capture packets.
When configuring SPAN on Cisco Catalyst switches to monitor a switchport that connects to a router or server, the real-time visual representation of network traffic has proven to be extremely useful as it’s much easier spot packet bursts and other traffic patterns.
 Real-time network utilization
Configurable Buffer Size
All traffic captured by the network analyzer is stored in a special buffer. This buffer usually resides in the workstation’s RAM and can be saved on the hard disk, so that additional analysis can be performed later. While most packet analyzers allow the buffer size to changed, its size is usually restricted to a few MB.
The ability to use an extremely large capture buffer e.g 1024MB or 1 Gigabyte, is necessary when performing analysis of heavy traffic where a couple of hundreds of MBs are typically required.
IP Conversation Tracking & Transaction Sequence Diagrams
A high-quality network analyzer smartly presents all captured information in an easy-to-understand manner, making it easy and fast to locate any IP Conversation between hosts:
 A high-quality packet analyzer displays IP Conversations between our workstation and Firewall.cx
Having the ability to drill-down into each IP Conversation is equally important. An Enterprise-class packet analyzer provides this important feature by simply double-clicking on any of the displayed conversations:
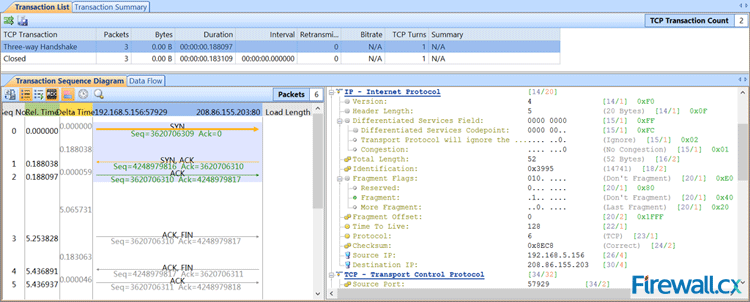 Enterprise-class packet analyzer allows us to drill-into each IP Conversation
The Transaction Sequence Diagram section on the left side displays the flow of packets of the displayed IP Conversation. Tracking TCP sequence numbers and TCP acknowledgements is often a very time-consuming process so using the right network analyzer will allow engineers to focus on the more important information.
Automatic Diagnostic Tools
Network engineers often need to deal with network problems that occur either from user configuration errors (e.g invalid Domain, incorrect URL etc) or other problems that are often difficult to identify.
Considering the fact your network analyzer captures all traffic, it should be able to automatically identify network/session problems and errors. This helpful feature helps dramatically when dealing with various network issues as it provides an overall view of problems that have been identified.
In many cases, these errors can lead to uncovering suspicious user activity or hacking attempts:
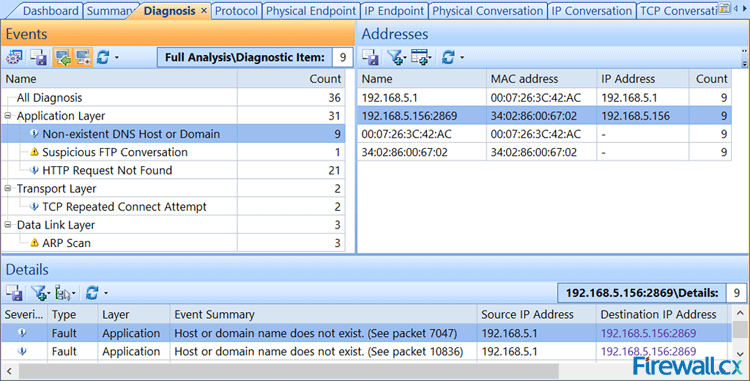
Automatically identift network problems that would otherwise be missed
As shown in the screenshot above, our network analyzer has identified 36 events that can be examined by double-clicking on the specific event in the left window and then selecting the associated addresses from the right window. Packets are then displayed at the bottom area. Double-clicking on these packets will open them for further examination.
Top Network Talkers
During times of excessive traffic, it is usually required to identify the network’s top talkers and take action. When supported by the network analyzer, it makes life very easy. When not supported, a sample of network traffic must be taken and sorted by the IP address with the greatest amount of data transferred.
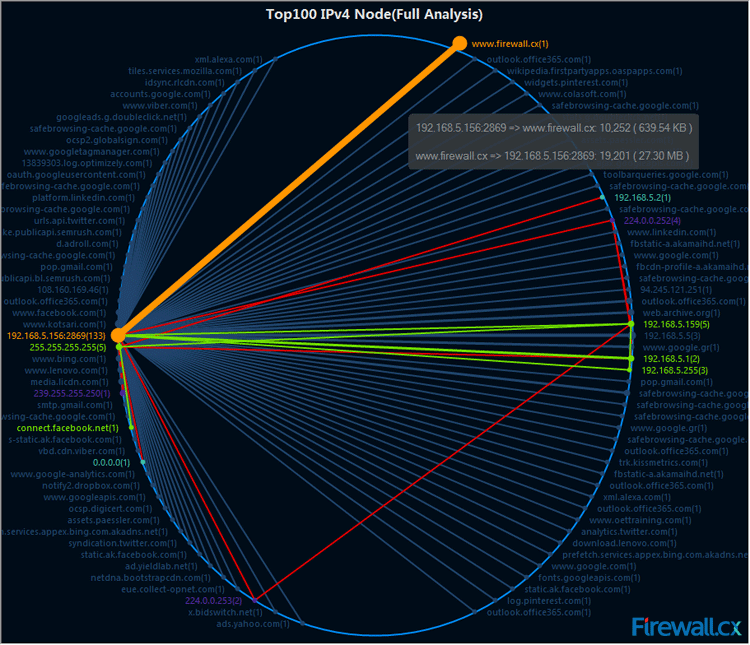 Monitoring the network’s top talkers and their traffic
Enterprise-class network analyzers provide 4 reports of Top Talkers: Top100 IPv4 Nodes (shown above), Top100 IPv4 Conversations (IP Based), Top100 Physical Nodes (MAC Based) and Top100 Physical Conversations (MAC Based).
Top IP’s can also be obtained via a Dashboard (shown below) which provides Global Utilization (% of total interface bandwidth) and Traffic (bytes) within a specific timeframe, Top IPs based on bytes transferred, and Top Application Protocols based on the protocol used:
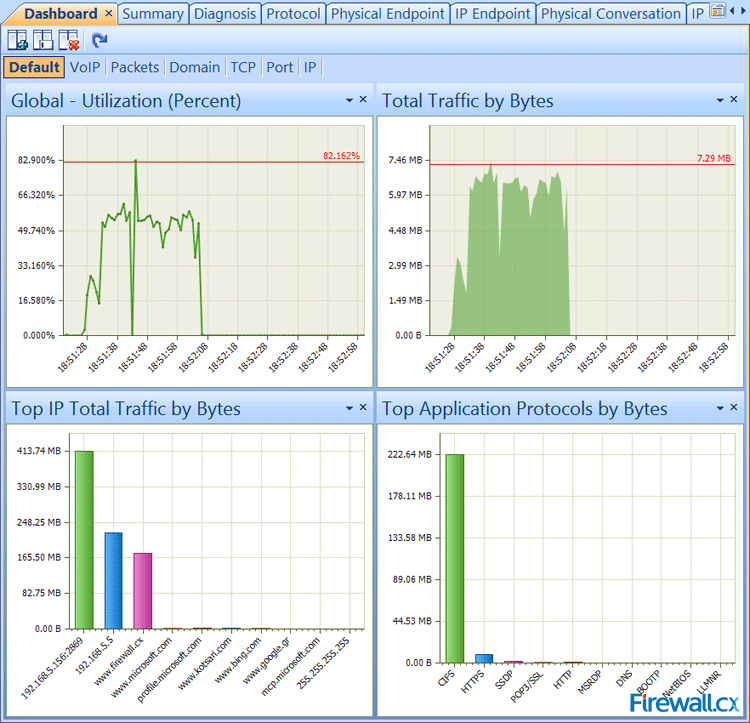
Network Analyzer dashboard providing a healthy amount of real-time information and traffic captured
Advanced Filtering
Filtering is a core feature that allows network engineers to select specific type of traffic based on its characteristics. Common filtering found on most network analyzers includes: Source/Destination MAC or IP address, Protocol and Port numbers.
Advanced filtering is a feature most engineers require in their network analyzer, but often don’t have. Advanced filtering allows special complex filters to be created based on additional characteristics such as Time, Packet size, Data Payload values in conjunction with AND/OR/NOT logical operations:
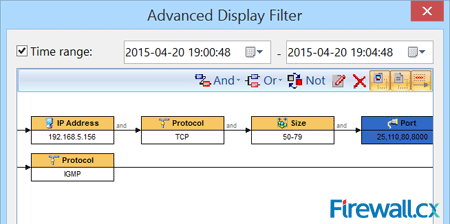 Advanced Filtering options are a must!
Summary
A high-quality network analyzer bundled with useful advanced features as the above will help any engineer or administrator diagnose and deal with network problems quickly and efficiently, but also capture suspicious network traffic patterns often associated with hacking attempts. When selecting your network tools, ensure they are of the highest quality and provide features that will help make your job easier. Our Network Protocol Analyzer section contains valuable articles to help you get started with Wireshark Network Protocol Analyzer.
Your IP address:
18.118.140.120
Wi-Fi Key Generator
Follow Firewall.cx
Cisco Password Crack
Decrypt Cisco Type-7 Passwords on the fly!


